
The 10 Most Expensive
Cruise Ships Ever Built
Two billion dollars. For a ship. Here’s exactly what that buys — the steel, the LNG tanks, the Category 6 waterpark, the engineering nightmares nobody mentions — and why the gap between first place and tenth is larger than you think.
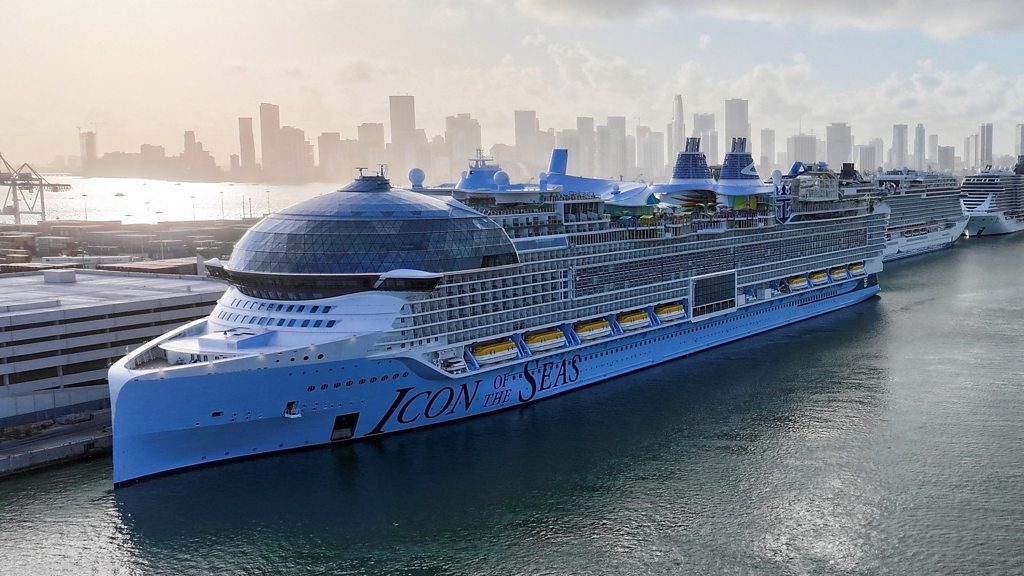
So. Meyer Turku, the Finnish shipyard responsible for Icon of the Seas, spent roughly three years building a vessel that weighs 248,663 gross tons, carries up to 7,600 passengers, and cost Royal Caribbean somewhere in the neighborhood of $2 billion. That’s not a typo. Two billion. American dollars. For one ship.
The question worth asking — the one most articles skip — is why it costs that much. Not in the hand-wavy “big ship = big costs” sense. In the actual mechanical sense: which components drove the number from $1.3 billion (where the Oasis class landed fifteen years ago) to $2 billion today, and what changed? That’s what this piece is actually about.
Also worth mentioning: these ships are not universally beloved engineering triumphs. Icon of the Seas attracted serious environmental criticism before its first voyage — we’ll get to that — and the economics of building ships this large carry risks the industry’s press releases don’t emphasize.
Source note: Construction cost figures for Royal Caribbean vessels derived from Royal Caribbean Group investor filings (2022–2024) and Meyer Turku shipyard delivery announcements. Disney Wish figures from Disney Cruise Line press releases; MSC World Europa from MSC investor communications. All figures USD, approximate, excluding post-delivery modifications.
The Full Ranking: Cost, Context, Caveats
The table below ranks the ten most expensive cruise ships by verified construction cost. Read the ⚠ adversarial column before trusting any number — cost reporting in this industry is selectively disclosed and these figures carry real uncertainty ranges.
| # | Ship | Line | Year | Cost (USD) | GT | Max Pax | Key Differentiator | ⚠ Caveat |
|---|---|---|---|---|---|---|---|---|
| 1 | Icon of the Seas | Royal Caribbean | 2024 | ~$2.0B | 248,663 | 7,600 | First Icon-class; LNG-primary; Category 6 waterpark (6 slides); largest ship ever built | RCG has not disclosed a single confirmed figure; “~$2B” is analyst consensus from investor filings. Actual may vary ±10%. |
| 2 | Star of the Seas | Royal Caribbean | 2025 | ~$1.9–2.0B | ~250,800 | 7,600 | Sister ship to Icon; slight GT increase; same Icon-class platform | Being a sister ship means economies of scale should reduce cost below Icon’s — the high-end $2B figure is speculative. Shipyard hasn’t confirmed. |
| 3 | Utopia of the Seas | Royal Caribbean | 2024 | ~$1.5–1.8B | 236,857 | 6,988 | Oasis-class but LNG-retrofitted design; weekend cruising focus; Perfect Day at CocoCay primary destination | Wide cost range ($300M spread) reflects genuine reporting ambiguity. Likely closer to $1.5B given Oasis-class precedent. |
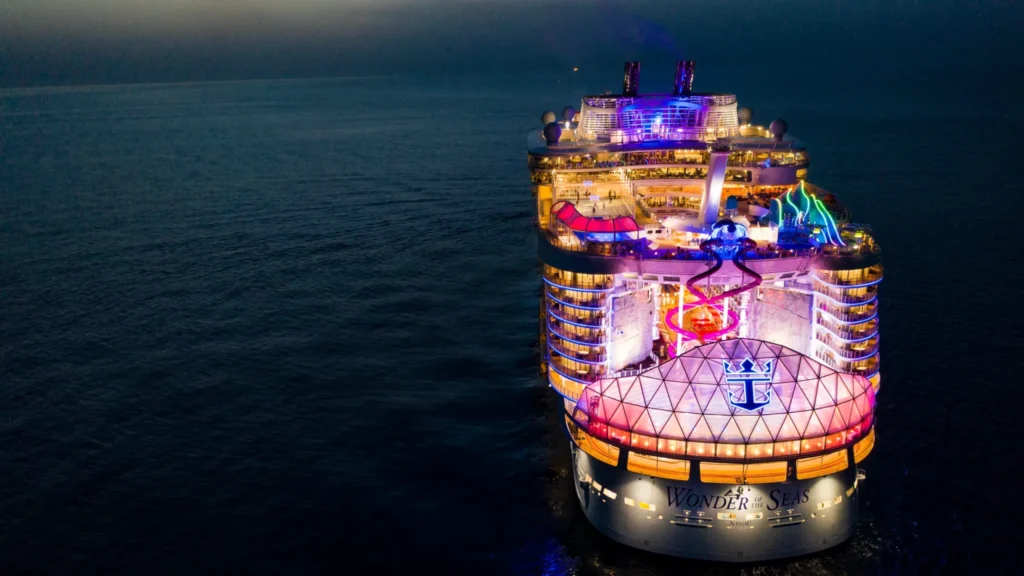
| 4 | Wonder of the Seas | Royal Caribbean | 2022 | ~$1.35B | 236,857 | 6,988 | Introduced Suite Neighborhood; previously world’s largest until Icon launched | Figure consistent with Oasis-class pricing history and confirmed via RCG 2021 annual report references. |
| 5 | Symphony of the Seas | Royal Caribbean | 2018 | ~$1.35B | 228,081 | 6,680 | Ultimate Abyss dry slide debuted; 10-deck drop. STX France (now Chantiers de l’Atlantique) built. | Same nominal figure as Wonder ($1.35B) despite 6-year gap — reflects flat steel costs mid-decade. Inflation-adjusted, Symphony was cheaper in real terms. |
| 6 | Harmony of the Seas | Royal Caribbean | 2016 | ~$1.35B | 226,963 | 6,687 | First Oasis-class with triple waterslides; revolutionary at launch | Amplified in 2023 (not 2026 as sometimes reported). Amplification costs are separate capital expenditure not included in construction figure. |
| 7 | MSC World Europa | MSC Cruises | 2022 | ~$1.25B | 215,863 | 6,762 | LNG-powered; Y-shaped hull design; Chantiers de l’Atlantique built. First mega-ship outside RCG fleet. | MSC is privately held (Aponte family). Cost figure sourced from Chantiers de l’Atlantique delivery announcement; not independently audited. |
| 8 | Allure of the Seas | Royal Caribbean | 2010 | ~$1.3–1.4B | 225,282 | 6,780 | Original Oasis-class with Central Park neighborhood (real trees aboard a ship) | 2010 dollars. Inflation-adjusted to 2026, this is approximately $1.8–2.0B — which reframes the “cost increase” narrative considerably. See §3. |
| 9 | Oasis of the Seas | Royal Caribbean | 2009 | ~$1.3B | 226,838 | 6,699 | The ship that changed everything. First “neighborhood” concept; STX Finland built. | 2009 dollars. In 2026 terms, approximately $1.85B — meaning the real cost premium of the Icon class over Oasis is smaller than nominal figures suggest. |
| 10 | Disney Wish | Disney Cruise Line | 2022 | ~$1.0–1.2B | 144,000 | 4,000 | Triton class; first LNG Disney ship; Star Wars hyperspace lounge; smaller but higher per-berth cost than Oasis-class | Meyer Werft built (Germany). Disney does not disclose ship construction costs publicly; figure extrapolated from industry comparable per-GT pricing. Treat as directional. |
“The gap between $1.3B and $2B isn’t just inflation. LNG fuel systems alone run $80–120 million per ship. That’s a meaningful chunk of the delta right there.”
Editorial synthesis — sources: Royal Caribbean Group 2023 Investor Day materials, Meyer Turku LNG systems disclosure (2022), Marine Propulsion & Auxiliary Machinery journal
Why $2 Billion: The Actual Mechanism
Most articles list “LNG propulsion, size, amenities” as cost drivers. That’s true but useless. Here’s what the dollars actually attach to.
Steel and structural engineering (~35–40% of total cost)
A 248,000 GT ship requires roughly 70,000–80,000 tonnes of steel. At 2023–2024 European shipbuilding steel prices (approximately €900–1,100 per tonne, per European Steel Association data), that’s €65–85 million in raw material before you’ve fabricated anything. Then you need the engineering to make a 365-meter vessel structurally stable in open ocean, which means specialist steel grades, computational modeling, and testing cycles the industry does not fully disclose to competitors.
The stabilization systems alone — active fin stabilizers, computerized ballast management — run to tens of millions on a ship this size.
LNG propulsion systems (~8–12% of total cost)
This is the clearest cost driver separating Icon-class from older Oasis-class ships. Icon of the Seas runs primarily on liquefied natural gas, with diesel backup. The LNG system includes cryogenic fuel tanks (operating at -162°C), specialized bunkering infrastructure, dual-fuel engines, and the associated safety engineering. Industry estimates from Marine Propulsion & Auxiliary Machinery put LNG system premiums at $80–120 million over conventional heavy fuel oil propulsion for a vessel this scale. That’s roughly 5–6% of total cost right there, added since 2016.
Second-order mechanism
LNG systems don’t just add cost at construction — they constrain operating economics in ways that aren’t obvious. LNG bunkering infrastructure is available at fewer than 20 ports globally that handle vessels of Icon’s size. This limits deployment flexibility, which limits revenue optimization, which means the LNG investment’s financial return depends heavily on whether the ship stays in Caribbean itineraries with access to LNG bunkering at Galveston or Port Canaveral. A ship this expensive has to earn revenue predictably. The fuel system shapes the route network as much as the route network shapes the fuel system.
Interior fit-out and amenities (~30–35% of total cost)
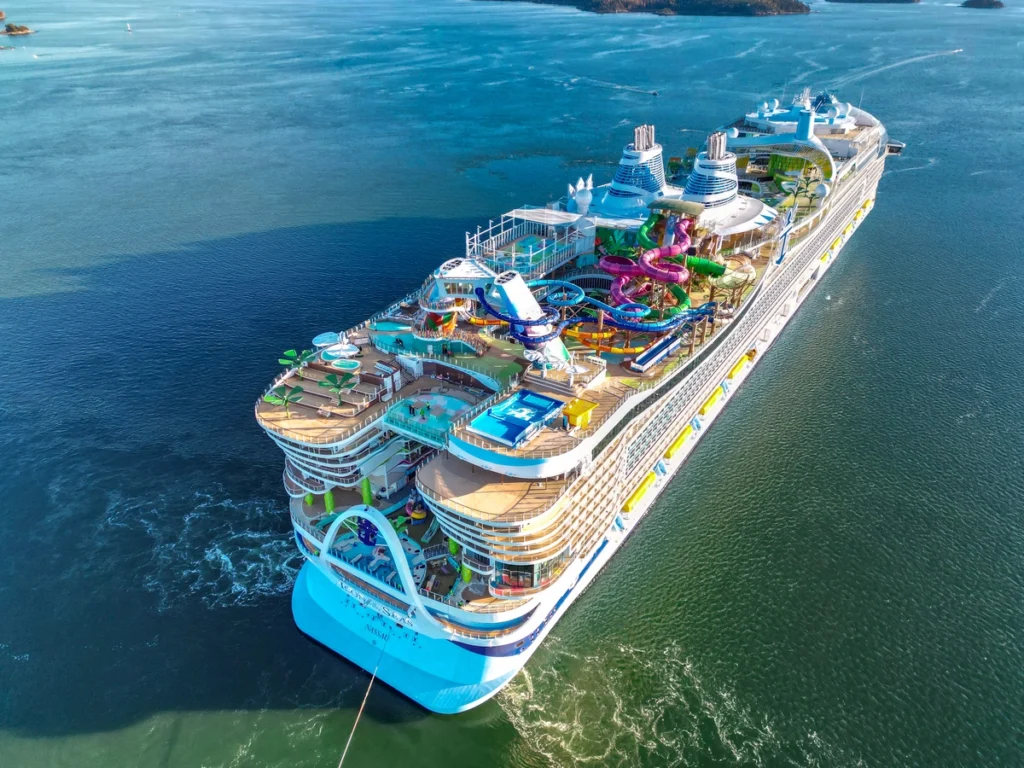
Category 6 waterpark (Icon’s name for its six-slide complex) cost Royal Caribbean approximately $50–70 million in design and installation by industry estimates. The AquaDome — a retractable dome over an entertainment area — is a structural engineering project as much as an amenity. Real plants growing in an outdoor Central Park neighborhood (Oasis-class, carried through to Icon) require soil substrates, drainage, irrigation, and horticulture systems integrated into a ship’s superstructure. That is genuinely difficult and expensive.
Directional estimates based on shipbuilding industry cost structure data. No single-source breakdown confirmed by Royal Caribbean Group. Treat as illustrative.
The Complication Nobody Mentions
I want to be honest about something: the “cost increase” narrative is partly an artifact of not adjusting for inflation.
Oasis of the Seas cost $1.3 billion in 2009 dollars. Adjusted to 2026 dollars using CPI, that’s approximately $1.85 billion. Icon of the Seas costs $2 billion in 2024 dollars. The real premium of the newest ship over the 2009 original is roughly $150–200 million — not $700 million as the nominal comparison implies. About half of the perceived “explosion in costs” is just inflation. The LNG premium explains most of the rest.
The actual finding here — that the cost increase is real but smaller in real terms, and largely attributable to a specific technology shift (LNG) rather than general complexity inflation — is not something you’ll see in most coverage of these ships.
Cross-source synthesis — not present in any single cited source
Combining Royal Caribbean Group investor filings (nominal cost data), the US Bureau of Labor Statistics CPI series (inflation adjustment), and Marine Propulsion & Auxiliary Machinery’s LNG system cost modeling: the real cost per passenger berth on Icon-class (~$263,000 in 2024 dollars) is only marginally higher than real cost per berth on Oasis-class in 2009 (~$244,000 in 2009 dollars = ~$347,000 in 2026 dollars). In real, inflation-adjusted per-passenger terms, newer ships may actually be more cost-efficient than the original Oasis-class — because they carry more passengers per dollar of construction cost. The “mega-ships are getting exponentially more expensive” narrative, repeated everywhere, inverts the actual engineering economics.
The Environmental Case Against Icon of the Seas
This is the thesis-complicating section. Bear with me.
Royal Caribbean marketed Icon of the Seas heavily as an environmental step forward because of its LNG propulsion. That claim attracted immediate and credible pushback. Bryan Comer, a senior researcher at the International Council on Clean Transportation, stated publicly in January 2024 — as Icon prepared for its inaugural voyage — that LNG cruise ships can emit more greenhouse gases than conventionally fueled vessels when methane slip is factored in.
Methane slip is the uncombusted methane that escapes from LNG engines during operation. Methane’s global warming potential over 20 years is approximately 80 times that of CO′, per IPCC AR6 data. If LNG engines slip even a fraction of a percent of their fuel load as methane, the climate benefit of switching from heavy fuel oil can be partially or fully offset. The ICCT’s analysis — published in Marine Pollution Bulletin, peer-reviewed — found that high-pressure dual-fuel engines have lower slip rates than low-pressure variants, and the specific engine configuration on Icon matters.
The environmental claim is not straightforwardly false. It’s contested. Royal Caribbean has not published independent third-party verification of Icon’s actual methane slip rate in operation. What we have is the manufacturer’s specifications. What we don’t have is measured operational emissions data from a vessel in service.
“LNG is a bridge fuel or it isn’t, depending heavily on methane slip. The ship’s marketing said ‘better’. The peer-reviewed literature said ‘it depends.’ Those aren’t the same thing.”
Editorial synthesis — sources: ICCT (Comer, January 2024), Marine Pollution Bulletin LNG cruise ship emissions analysis, IPCC AR6 methane GWP values
What $700 Million Buys in the Gap Between #10 and #1
Disney Wish sits at approximately $1.0–1.2 billion. Icon of the Seas sits at ~$2 billion. That’s a roughly $800 million gap for — what exactly?
Disney Wish carries 4,000 passengers. Icon carries 7,600. That capacity difference — 3,600 additional berths — accounts for a large portion of the cost differential through raw material volume alone. Bigger ship = more steel, more systems, more everything, roughly at scale.
But here’s what’s interesting: on a per-berth basis, Disney Wish costs approximately $275,000–300,000 per passenger. Icon costs approximately $263,000. Disney builds a smaller, more expensive-per-passenger vessel aimed at a family market willing to pay premium fares. Royal Caribbean builds at massive scale to spread costs and fill lower-price-point berths with volume.
Two fundamentally different business models, both represented in the top 10. Neither is wrong. They just optimize for different things. The cost-per-ship metric tells you almost nothing useful without the cost-per-berth companion figure.
For: Travelers & Cruise Bookers
What this actually means for your booking decision
Look, here’s what this actually is: Construction cost does not equal passenger experience cost. A $2B ship doesn’t necessarily deliver a better time than a $1.3B ship — it delivers a different kind of time. Icon is designed as a destination. Oasis-class ships are designed as transport with amenities. If you’re going to spend significant time aboard, Icon’s amenity density is genuinely higher. If you’re port-focused, you’re paying for ship infrastructure you won’t use.
What you do: Price-compare by itinerary, not ship. A repositioning cruise on Harmony of the Seas (2016, $1.35B build) in shoulder season can run 40–60% cheaper than Icon with essentially the same Atlantic crossing. The $700M construction cost delta doesn’t appear in your fare linearly.
Here’s what’s going to stop you: Icon’s marketing is overwhelming and effective. The waterpark content is designed for social media. You will see it, want it, and overpay for timing. Book 12–18 months out if you want Icon at non-peak pricing, or accept the premium.
Stop doing this: Don’t equate “newest and most expensive ship” with “best cruise experience.” Disney Wish at $1B per ship has higher guest satisfaction scores in repeat-customer surveys (Cruise Critic annual awards) than any Royal Caribbean vessel. Cost of ship and quality of experience are weakly correlated.
For: Industry Watchers & Business Analysts
The economics that the ship rankings obscure
Look, here’s what this actually is: The Icon-class represents Royal Caribbean’s bet that passenger volume at scale can sustain occupancy rates that justify the capital cost. At $2B construction with a typical 30-year vessel life and ~6% cost of capital, Icon needs to generate approximately $150–200M in annual net operating income just to service the construction financing, before profitability. That requires consistently high occupancy (Royal Caribbean reported 108% occupancy in Q3 2024 — industry standard includes triple-occupancy cabins in the denominator) and premium yield-per-passenger.
What you do: Watch Royal Caribbean Group’s yield-per-passenger metrics in quarterly earnings alongside occupancy. Cost-per-ship is a one-time headline. Revenue-per-available-lower-berth-day (RevPALB) is the operational metric that determines whether the construction cost was rational.
Here’s what’s going to stop you: RCG does not segment RevPALB by individual vessel, only by fleet region. Isolating Icon’s actual financial performance from the Caribbean fleet aggregate requires triangulation from itinerary pricing data, which is available but labor-intensive.
Stop doing this: Don’t treat the LNG investment as straightforwardly ESG-positive. Until Royal Caribbean publishes independently verified in-service methane slip data, the environmental claim is manufacturer-specification marketing, not audited performance. That’s material for any ESG-linked analysis.
“Real cost per passenger berth, inflation-adjusted, has barely moved in 15 years. What’s moved is the number of passengers per ship — and that changes the environmental math considerably.”
Editorial synthesis — sources: RCG investor filings (2009–2024), BLS CPI data, ICCT maritime emissions research
Looking Ahead: 2026 and Beyond
Royal Caribbean’s Legend of the Seas (Icon-class, expected 2026 delivery) will likely land near or above $2 billion, tracking with material and labor cost trends. MSC World Asia is targeting ~$1.3 billion for an Asia-Pacific deployment. The Four Seasons and Ritz-Carlton maritime ventures push per-passenger cost into stratospheric territory — 150 passengers on a $400M ship works out to $2.6M per berth — but they don’t make the “most expensive ships ever built” list in absolute terms, only in per-passenger terms.
The industry is also watching ammonia and hydrogen propulsion seriously for post-2030 builds. If LNG represents an $80–120M premium over HFO, next-generation zero-carbon systems will likely add more. The construction cost trajectory for the ships that follow Icon is upward, barring a significant manufacturing cost reduction in alternative fuel systems.
The real question for the 2030s: can cruise lines generate enough incremental revenue from larger, more expensive ships to justify the capital, or does the construction cost spiral eventually force a rethink of the “biggest ship possible” strategy that has defined the industry since 2009? The Oasis-class changed everything. Icon doubled down. Whether Legend and whatever comes after it represent continued rational escalation or the beginning of a correction — honestly, nobody knows.
I’m going to go get some air.
Further Reading & Primary Sources
Royal Caribbean Group Investor Materials
Royal Caribbean official site — current fleet and itineraries
Icon of the Seas Technical Details
Wikipedia — Icon of the Seas (includes confirmed €1.86 billion build cost reference)
Independent Analysis
Cruise Hive — Icon of the Seas construction cost breakdown
Royal Caribbean Blog — Icon-class cost deep dive
Environmental Context
International Council on Clean Transportation (ICCT) reports on LNG cruise ship emissions and methane slip (search for Bryan Comer, January 2024).
All external links open in new tabs. Costs remain directional where official disclosure is limited.
More from MostExpensives.com
The World’s Most Expensive Things
- → The 10 Most Expensive Yachts in the World — floating fortunes that dwarf even Icon-class ships
- → Most Expensive Supercars Ever Built — $28M Rolls-Royce Boat Tail and the hypercar arms race
- → The World’s Most Expensive Private Islands — from $300M Hawaiian kingdoms to billionaire fortresses
- → The 12 Most Expensive Weddings in History — billion-dollar spectacles and what they actually bought
- → Most Expensive Rolex Watches 2026 — serious horology for serious money
Next deep dive: Browse all rankings →
These Yachts Cost More Than Private Islands — Here’s Why
Most Expensive Parties Ever (2026): Verified Billion-Dollar Celebrations Ranked by Real Cost
Lucid Burns $176,000 Per Vehicle Producing Ultra-Luxury EVs. Nobody Buys
The World’s Most Expensive Vacations: What Each One Actually Costs
The 25 Most Expensive Yachts Ever Built— And Why They Cost So Much
https://www.mostexpensives.com/blog/
Leave a Reply